Formal Methods & Artificial Intelligence meet Human-Computer Interaction to Visualize Explications
The scientific challenge of seamless support for perspicuity hinges on pioneering advances on the connection between formal, mathematical explications, and user-perceivable explanations. While explications rely on formal system models and mathematically well-founded specification and reasoning concepts, explanations require intuitive visual interfaces and a higher level of abstraction, so as to make systems understandable, plausible, and justifiable for human users. Based on strong interdisciplinary teamwork in previously rather unconnected domains, we were able to develop several novel approaches for visualizing explications that significantly advance the state of the art.
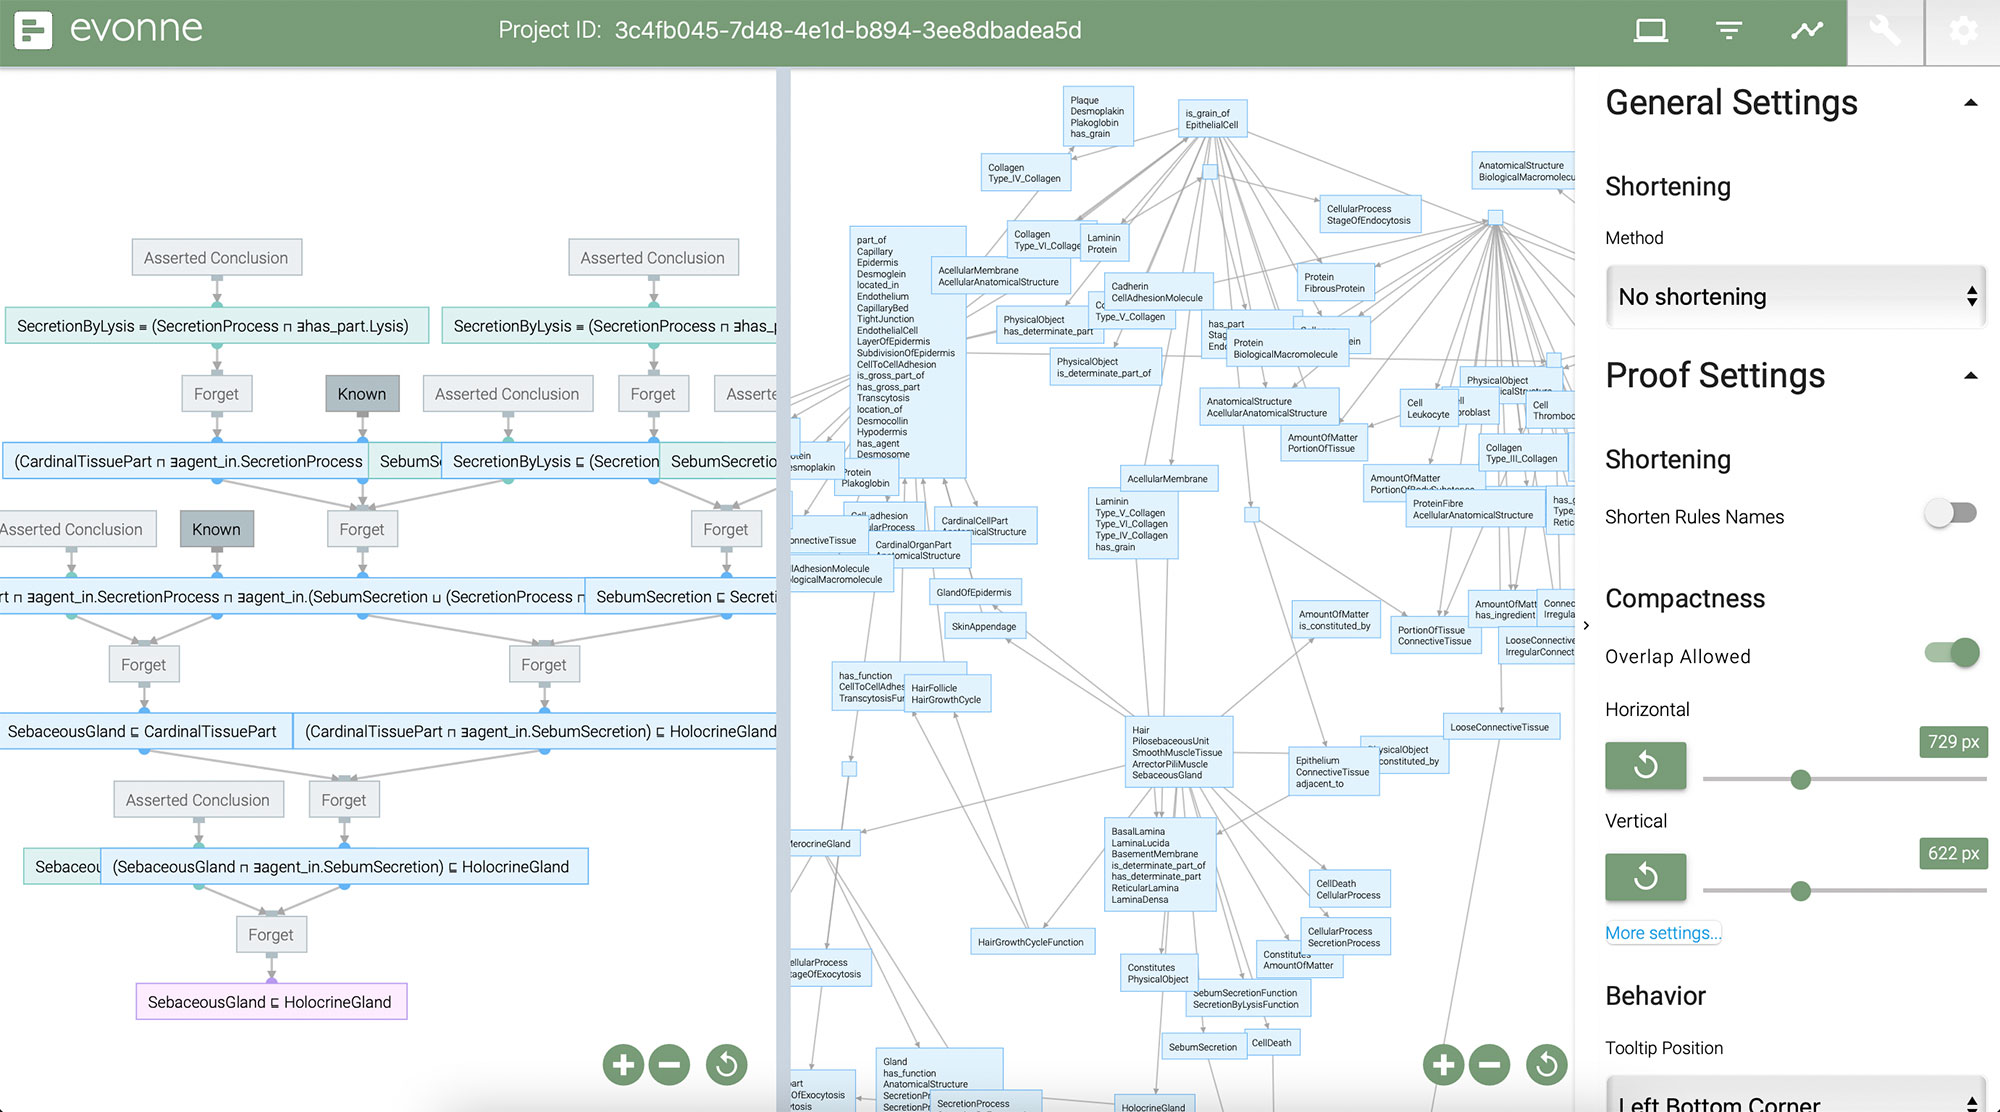
Evonne – A Visual Tool for Explaining Reasoning with OWL Ontologies and Supporting Interactive Debugging
The visualization tool Evonne is tailored towards explaining logical consequences. In addition, it supports the debugging of unwanted consequences and allows interactive comparison of the impact of removing knowledge from the ontology. Evonne’s visual approach combines: (a) specialized views for the explanation of logical consequences and the structure of the ontology, (b) employing multiple layout modes for iteratively exploring explanations, (c) detailed explanations of specific reasoning steps, (d) cross-view highlighting and color coding of the visualization components, (e) features for dealing with visual complexity, and (f) comparison and exploration of possible fixes to the ontology.
Visit project website: https://imld.de/evonne
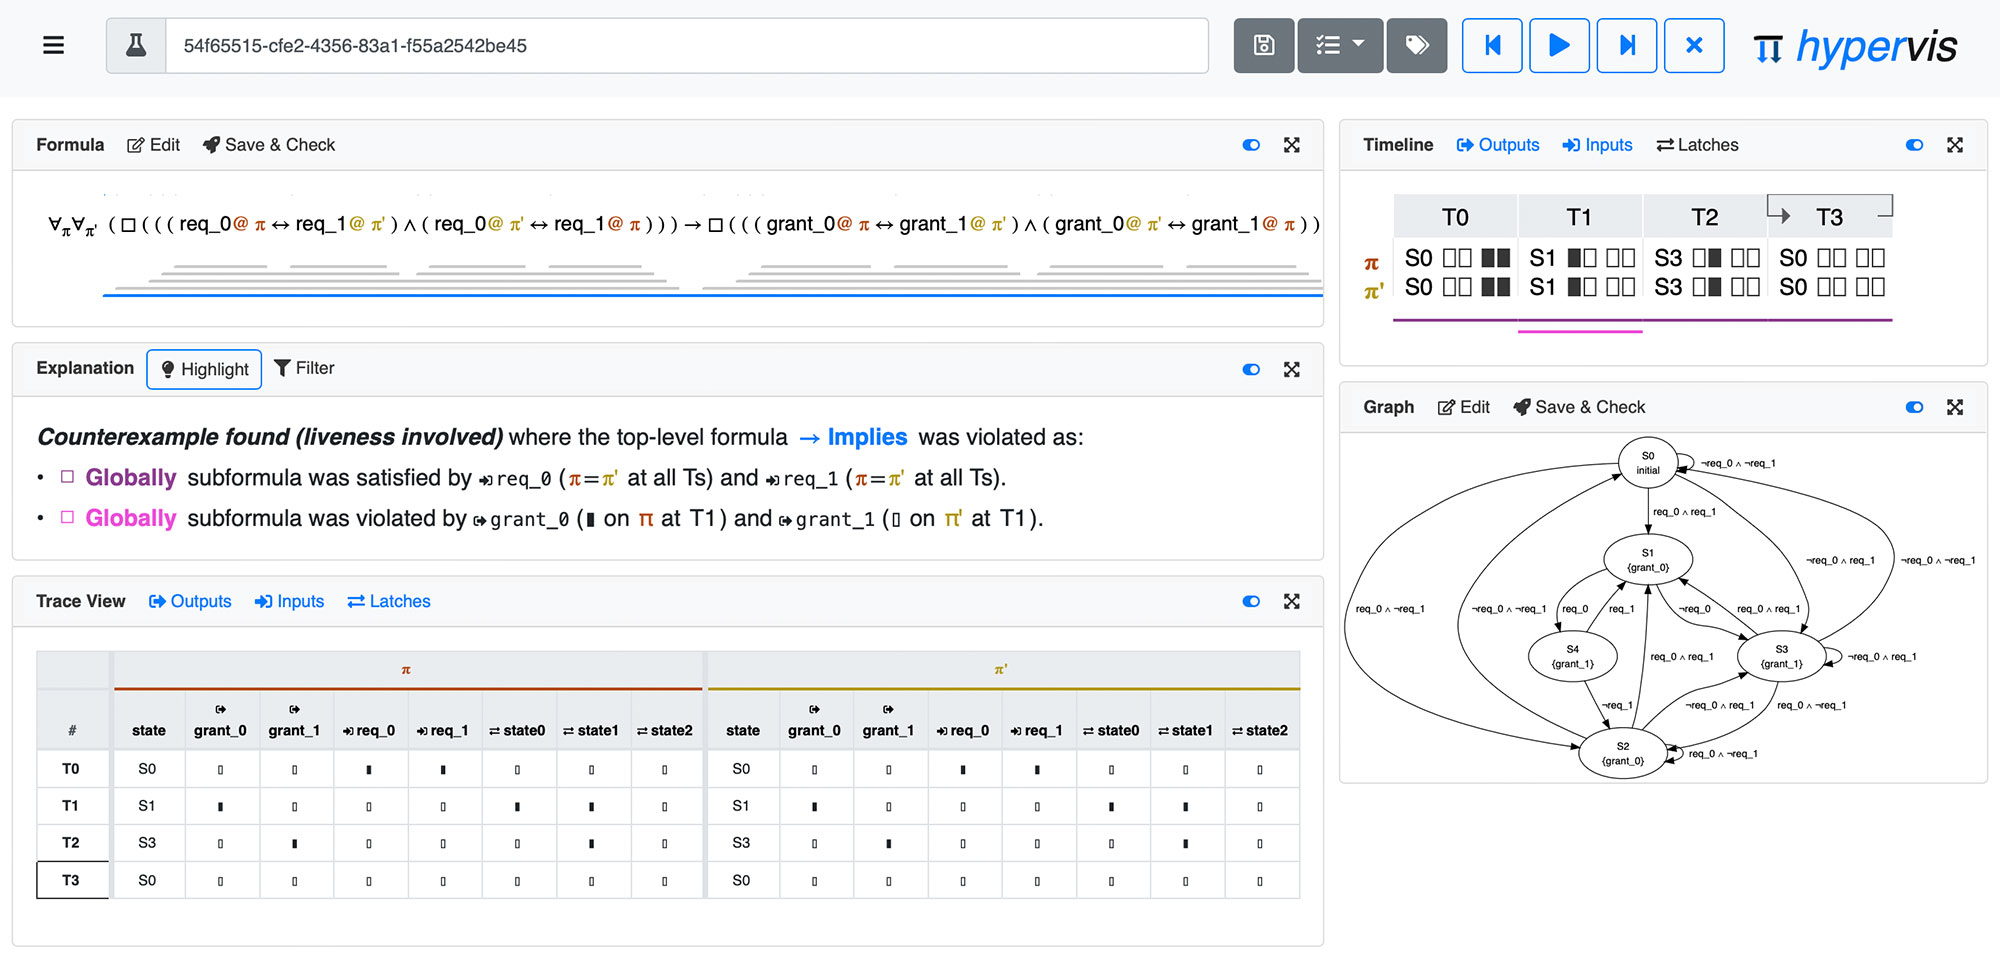
HyperVis – Explicating Model Checking Results for Hyperproperties
HyperVis is an interactive tool for explicating and visualizing counterexamples to hyperproperties, such as noninterference and other information-flow policies. The included visualizations can effectively communicate the core aspects of the model checking result. The features of HyperVis notably support analysts in understanding the error leading to a counterexample as well as iterating a provided system and specification.
Visit project website: https://imld.de/hypervis
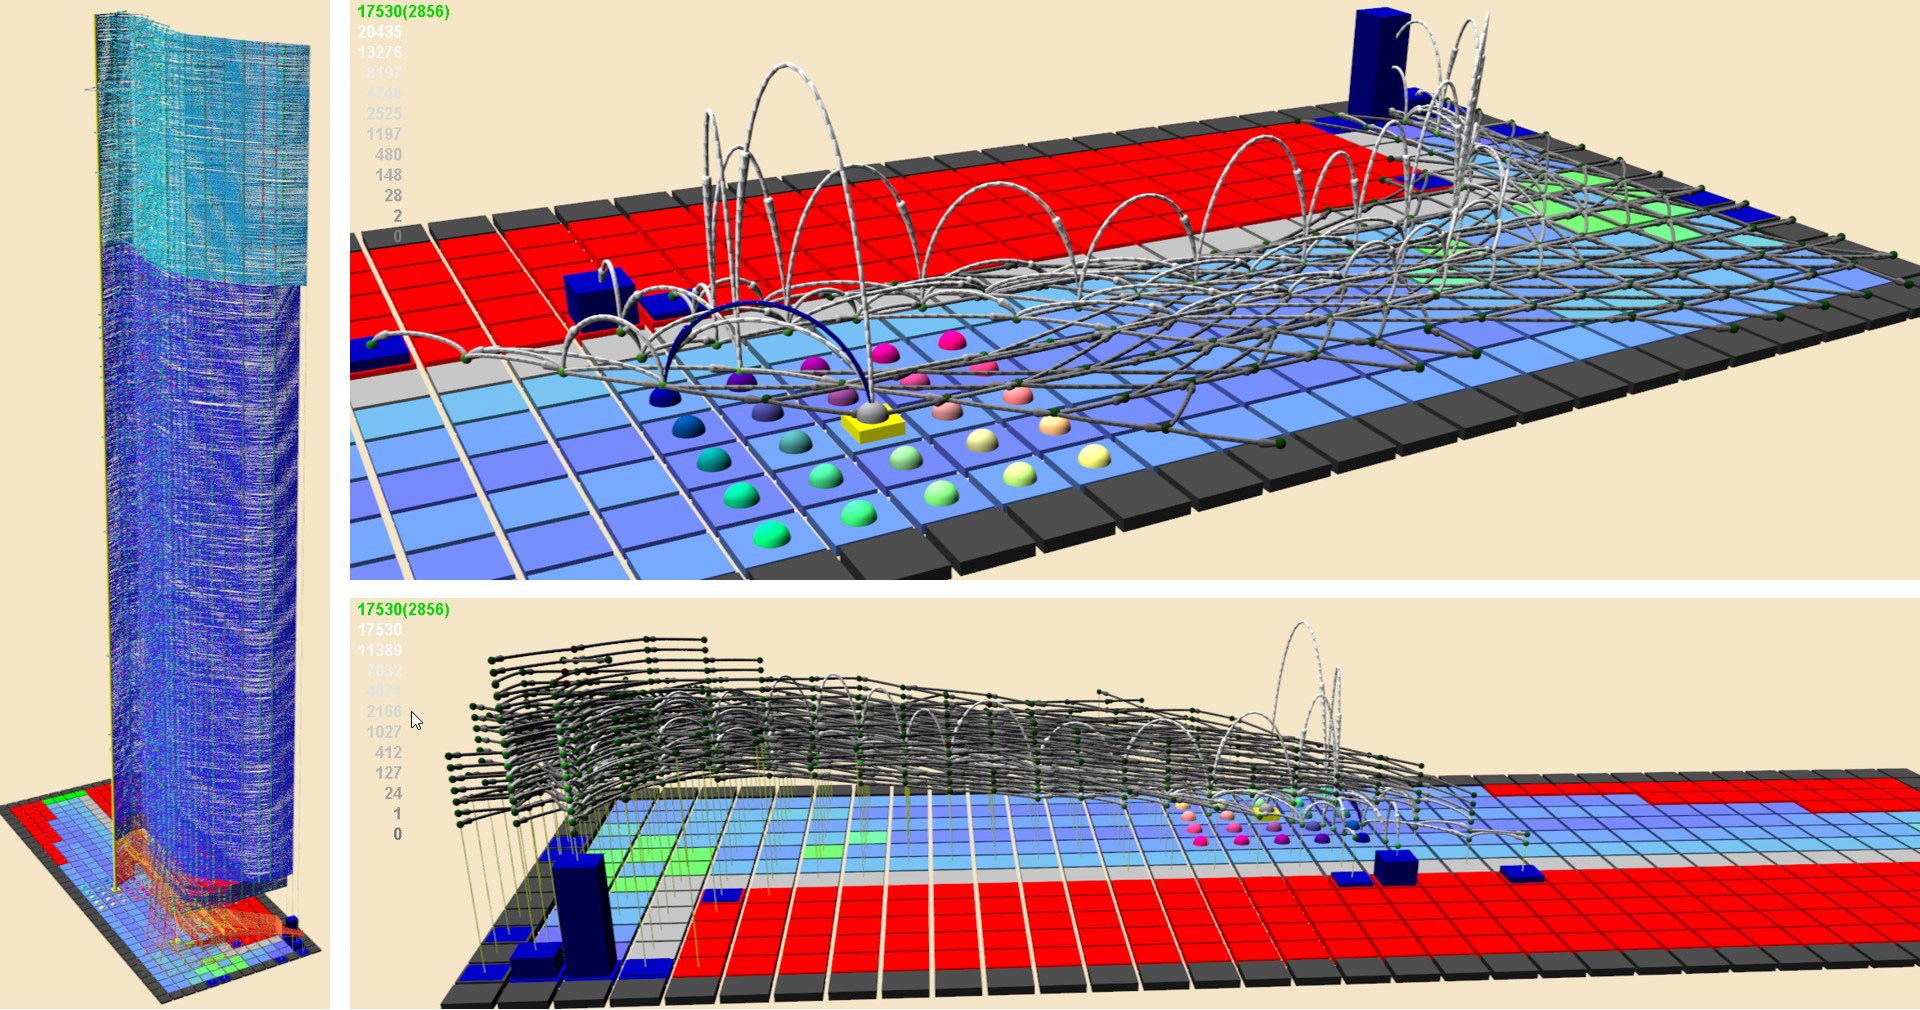
TraceVis – Visualization for Deep Statistical Model Checking
We explore the use of visualization to support users users (human analysts, domain engineers) of deep statistical model checking (DSMC). TraceVis is an interactive visualization tool for the Racetrack case study. It allows to explore crash probabilities into particular wall segments as a function of start position and velocity, as well as supports the in-depth examination of the policy traces generated by DSMC, in aggregate form as well as individually.
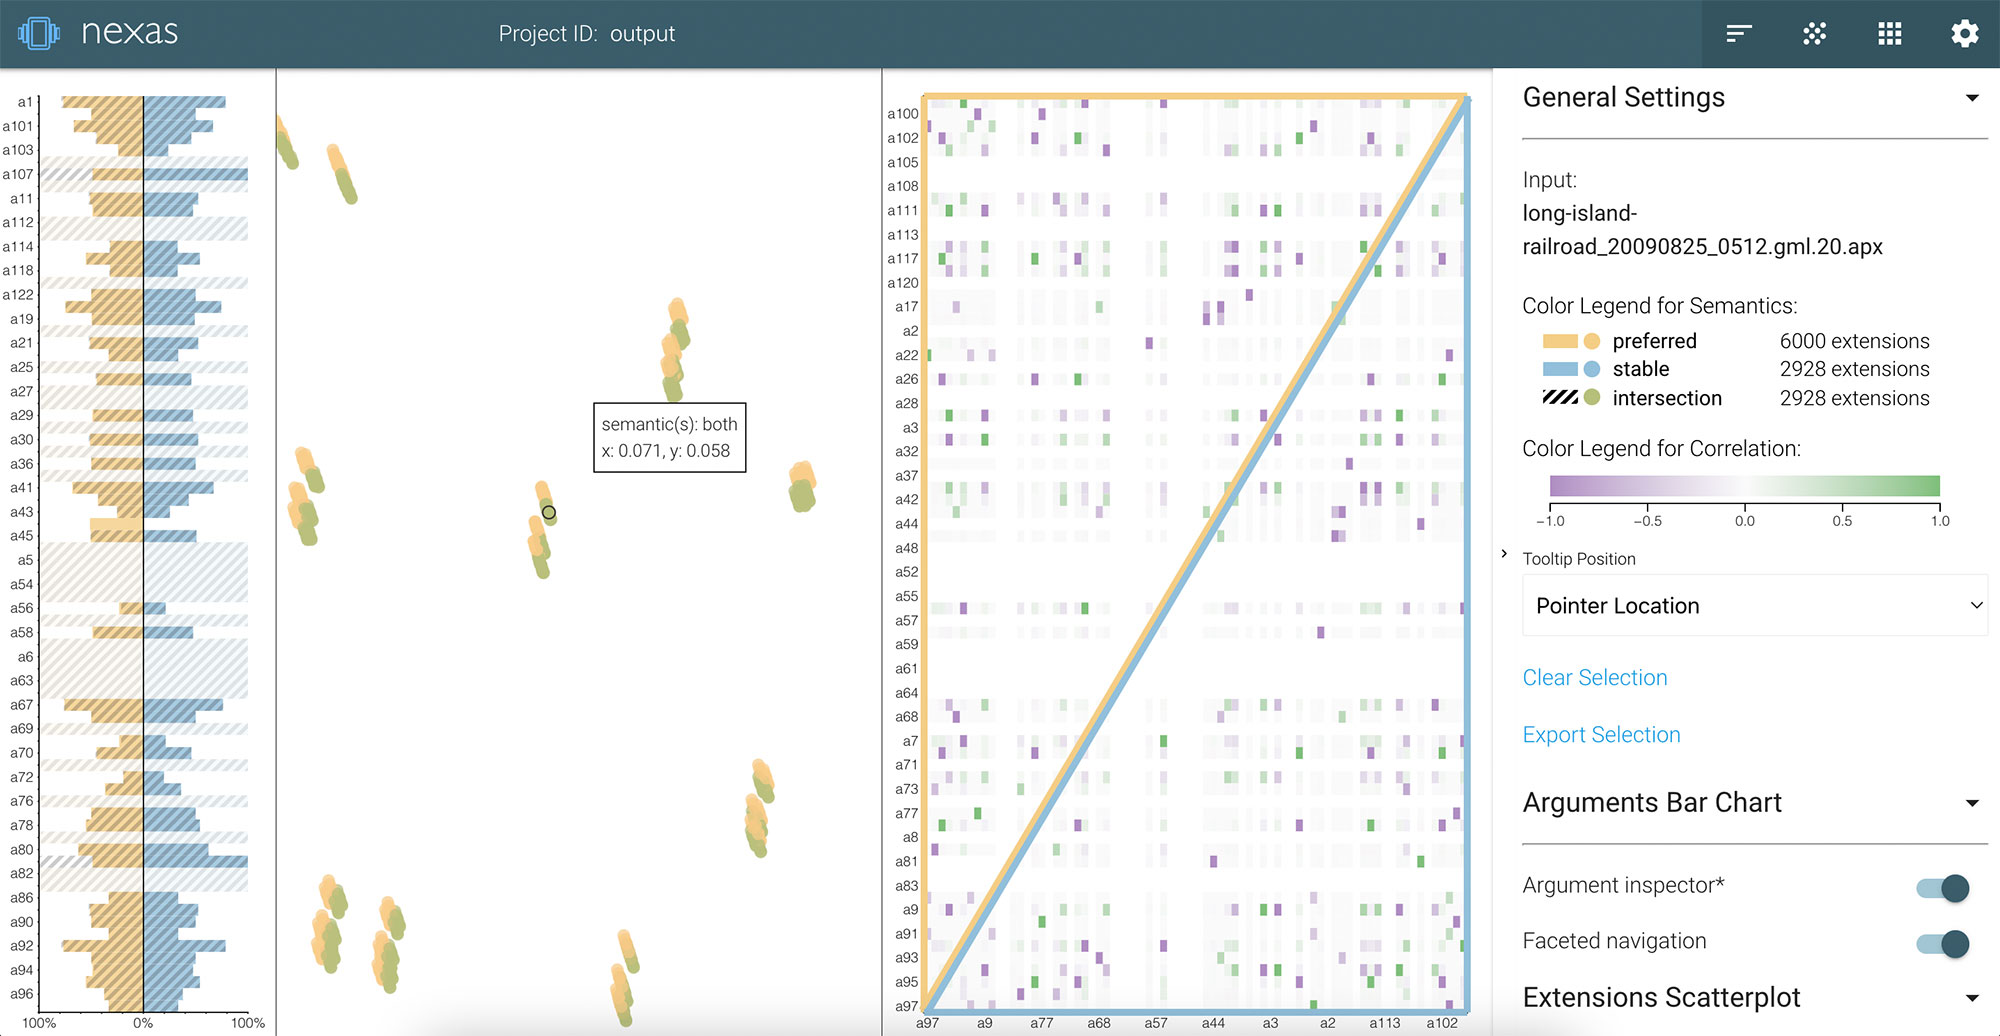
NEXAS – A Visual Tool for Navigating and Exploring Argumentation Solution Spaces
NEXAS is an interactive tool for exploration of solution spaces of argumentation frameworks. It implements visually an approach for answer set navigation that enumerates extensions and zooms into sub-spaces of interest with respect to so-called facets of the semantics of the framework. The tool consists of three major coordinated views that altogether foster exploration, navigation and understanding of the framework.
Visit project website: https://imld.de/nexas